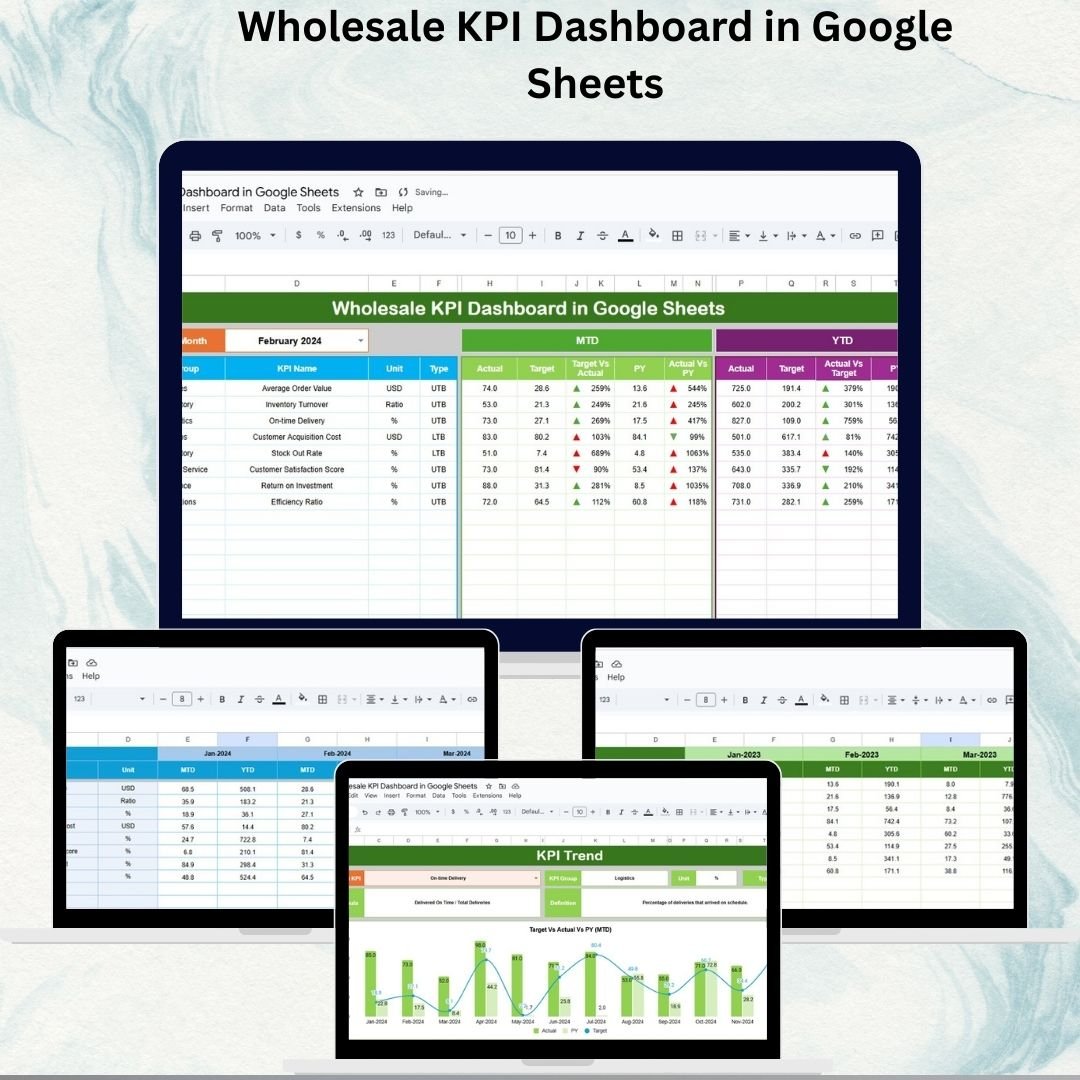
Running a wholesale business means handling complex operations — from managing sales and inventory to monitoring delivery performance and customer satisfaction. Without a proper tracking system, it’s easy to miss important trends, face inefficiencies, and lose revenue opportunities. That’s why we built the Wholesale KPI Dashboard in Google Sheets — a ready-to-use tool that centralizes all wholesale performance metrics into one powerful and interactive dashboard. �� This template helps managers, business analysts, and executives make data-driven decisions by providing instant visibility into sales, customer satisfaction, delivery timelines, and cost management. With automated comparisons for Month-to-Date (MTD), Year-to-Date (YTD), and Previous Year (PY) performance, it ensures you always stay one step ahead. Wholesale KPI Dashboard in Google Sheets �� Key Features of the Wholesale KPI Dashboard �� Dashboard Tab – Real-Time Insights Select a month (drop-down in cell D3) to update KPIs instantly MTD Actual vs Target vs Previous Year, with ✅ up/down arrows for quick performance checks YTD performance for long-term tracking Visual cards and charts summarizing critical wholesale KPIs �� KPI Trend Tab – Deep Dive Analysis Pick any KPI (drop-down in cell C3) to view its trends over time Displays KPI Group, Unit, Formula, Definition, and Type (LTB/UTB) Trend charts for spotting recurring performance gaps �� Actual Numbers Tab – Performance Data Entry Record MTD and YTD actual values Month selector in cell E1 automatically updates dashboard metrics Perfect for tracking KPIs like sales, returns, delivery time, and inventory levels �� Target Tab – Benchmark Your Goals Define monthly and annual targets for each KPI Compare actuals against targets to identify achievement gaps Aligns business goals with performance outcomes �� Previous Year Tab – Historical Benchmarking Enter prior year data for MTD and YTD Compare current performance with historical benchmarks Identify seasonal trends and long-term growth patterns �� KPI Definition Tab – Standardized Metrics Clear documentation of all KPIs Includes Name, Group, Unit, Formula, Definition, and Type (LTB/UTB) Ensures consistent understanding across teams �� What’s Inside the Template? ✅ Dashboard Tab – Real-time KPI overview✅ KPI Trend Tab – Drill-down analysis by metric✅ Actual Numbers Tab – Input MTD & YTD data✅ Target Tab – Define KPI goals✅ Previous Year Tab – Compare with past performance✅ KPI Definition Tab – KPI glossary with formulas �� How to Use the Wholesale KPI Dashboard Input Actuals – Update the Actual Numbers tab with monthly performance Set Targets – Define expected KPI values in the Target tab Add Previous Year Data – Record last year’s performance for benchmarking Review Dashboard – Monitor MTD & YTD results visually Drill into Trends – Use KPI Trend tab to analyze detailed metrics Check KPI Definitions – Ensure consistency with documented formulas �� Who Can Benefit from This Dashboard? �� Wholesale Managers – Track overall operations in real time �� Business Analysts – Deep-dive into performance trends �� Executives – Monitor growth and profitability at a glance �� Supply Chain Teams – Improve delivery timelines & inventory control �� Finance Teams – Track cost efficiency & performance gaps ⭐ Advantages of Using the Wholesale KPI Dashboard �� Centralized KPI Tracking – All wholesale metrics in one place ⚡ Dynamic & Interactive – Month selector updates dashboard instantly �� Historical Benchmarking – Compare current vs last year’s results �� Target vs Actual Insights – Measure success against defined goals ✅ Data-Driven Decisions – Identify bottlenecks & optimize operations �� Customizable – Easily adapt KPIs to your business �� Click here to read the Detailed blog post �� Visit our YouTube channel to learn step-by-step video tutorials


 Import UK
 Import Germany
 Import UK
 Import UK