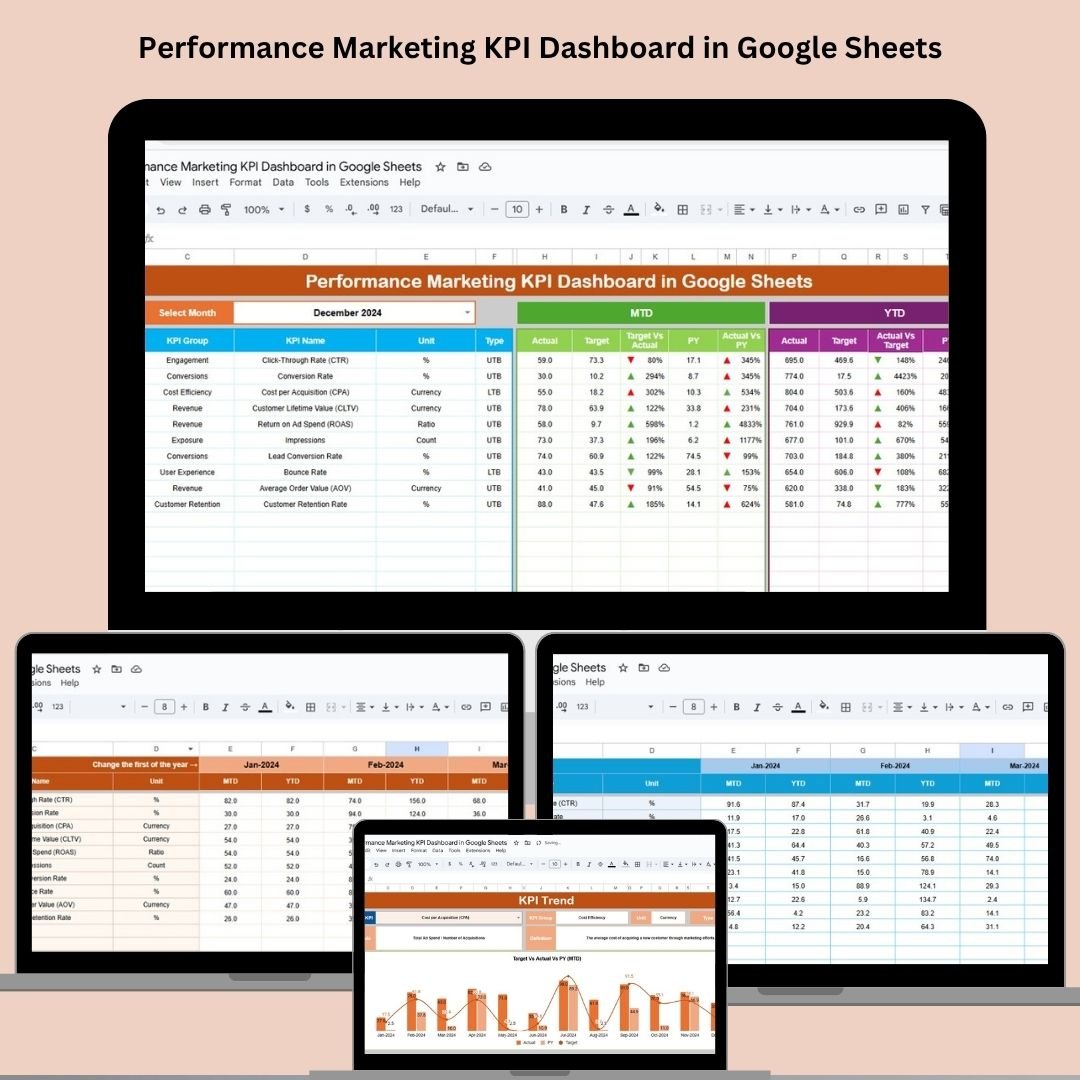
Get laser-focused on results with the Performance Marketing KPI Dashboard in Google Sheets—a ready-to-use, data-driven tool to track what truly matters in your campaigns. Whether you’re running ads, optimizing landing pages, or managing paid funnels, this dashboard is your marketing command center! Performance Marketing KPI Dashboard ⚙️ Key Features of the Performance Marketing KPI Dashboard �� Centralized Dashboard SheetGet an instant snapshot of your performance. View MTD (Month-to-Date) and YTD (Year-to-Date) Actuals, Targets, and Previous Year data—all updated in real-time based on your inputs. �� Month Selector DropdownQuickly switch between months using the smart dropdown. One click updates all KPI visuals instantly. ���� Conditional FormattingUp and down arrows highlight performance against targets. Green = On Track. Red = Needs Attention. �� Trend Analysis with KPI SelectorThe KPI Trend Sheet lets you choose any KPI and see historical trends, helping you spot what’s working and what’s not over time. �� Definition SheetEach KPI is clearly defined with formula, unit, group, and its tracking type (UTB or LTB), giving you full transparency. �� Dynamic CalculationsWhether it’s ROAS, CAC, or CTR, your metrics are calculated automatically and displayed clearly. �� Clean Input SheetsUse the Actuals, Targets, and Previous Year sheets to plug in data—your dashboard reflects updates instantly, no formulas needed from your side. �� What’s Inside the Performance Marketing KPI Dashboard Here’s what you’ll find in this plug-and-play template: ✅ Dashboard Tab – All KPIs in one interactive view✅ KPI Trend Tab – Visualize performance over time✅ Actual Number Sheet – Input MTD/YTD actuals✅ Target Sheet – Set your campaign goals✅ Previous Year Sheet – Historical data comparison✅ KPI Definition Sheet – Metric explanations and formulas Each tab is built to auto-sync with the main dashboard, ensuring seamless updates and meaningful insights. ���� How to Use the Performance Marketing KPI Dashboard �� Step 1: Enter your current month and YTD performance in the Actuals Sheet�� Step 2: Set realistic monthly and annual goals in the Target Sheet�� Step 3: Log last year’s numbers in the Previous Year Sheet�� Step 4: Select the reporting month on the Dashboard�� Step 5: Track changes with automatic charts, KPIs, and indicators�� Step 6: Share your dashboard with team members or export to PDF It’s as simple as fill, filter, and focus. �� Who Can Benefit from This Performance Dashboard? ���� Digital Marketing Managers – Align campaigns with KPIs in real-time�� Media Buyers & PPC Experts – Track ROI, CTR, CAC, and more�� Marketing Analysts – Get deep-dive trends to advise stakeholders�� Agencies – Use it as a client-ready reporting tool�� Startups & Entrepreneurs – Make informed growth decisions with no-code tracking�� Freelancers – Showcase results professionally without investing in BI tools ✅ Why Choose This Google Sheets Dashboard? ✔ Built in Google Sheets – access it from anywhere, anytime✔ No software or plugin needed – just your browser✔ Easy to customize – add your brand colors or extra KPIs✔ Real-time metrics and auto-updates✔ Shareable, secure, and cloud-backed �� Click here to read the Detailed blog post Watch the step-by-step video Demo: �� Visit our YouTube channel to learn step-by-step video tutorials Youtube.com/@NeotechNavigators


 Import UK
 Import Germany
 Import UK
 Import UK