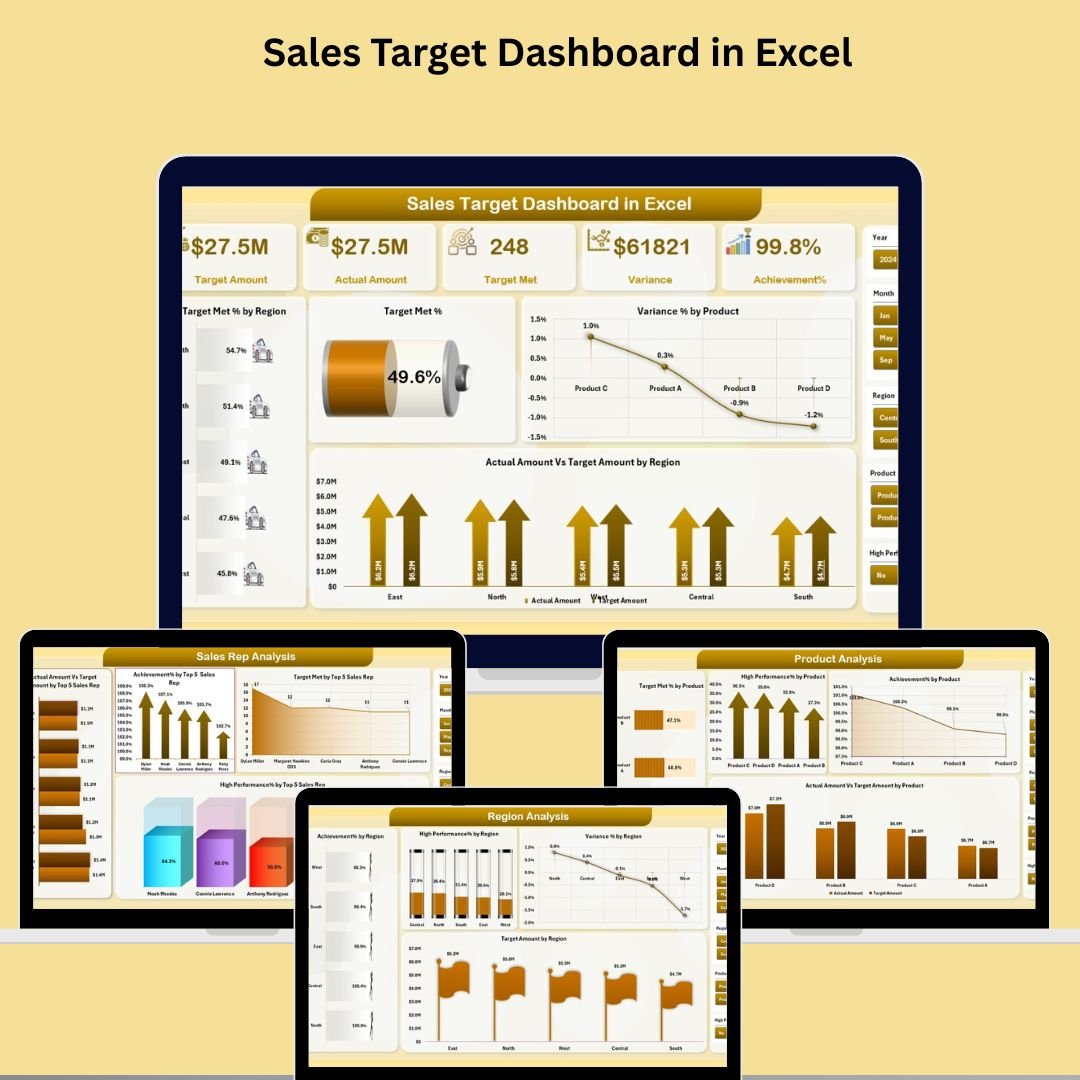
�� Key Features of Sales Target Dashboard in Excel �� Track Sales vs Target with PrecisionVisualize how your sales reps, products, or regions are performing with real-time comparisons of actual vs target sales. �� Achievement % & Variance at a GlanceEasily monitor achievement percentages, target met %, and variance % to see what’s working—and what’s not. �� Region-Wise DrilldownGet clear visibility into regional performance. Identify which regions are outperforming and where extra support is needed. ���� Sales Rep Performance MetricsRank top-performing sales reps and identify those falling short with detailed rep-level KPIs and charts. �� Product Performance TrackingSpot high-demand products and those missing their targets. Make informed inventory and marketing decisions. �� Monthly Trend AnalysisDiscover performance trends over time to support quarterly reviews and forecasting. �� Slicers for Smart FilteringFilter data by region, sales rep, product, month, or year to create custom reports instantly. ��️ No Add-ins NeededBuilt entirely in Excel—just plug in your data and you’re good to go! �� Professional-Grade VisualsPolished metric cards, interactive charts, and slicers make this dashboard boardroom ready. �� What’s Inside the Sales Target Dashboard in Excel ✅ Excel File with 5 Dashboard Pages: Sales Target Dashboard Overview Page – KPI cards, charts, slicers Region Analysis Page – Compare sales by location Sales Rep Analysis Page – View top 5 performer metrics Product Analysis Page – Measure product-level targets Monthly Trends Page – Track progress month by month ✅ Prebuilt Metric Cards – Total Sales, Target, Achievement %, Target Met %, Variance % ✅ Powerful Charts – Actual vs Target, Target Met %, High Performance %, Achievement % ✅ Slicers (Filters) – Region, Sales Rep, Product, Month, Year ✅ User Guide – Included with step-by-step instructions for updating and customizing the file ✅ Customizable Design – Add your own branding, metrics, or pages easily ⚙️ How to Use the Sales Target Dashboard in Excel �� Step 1: Open the FileLoad the prebuilt Excel dashboard. Navigate between pages using the Page Navigator. �� Step 2: Input or Update DataUpdate the ‘Actual’ and ‘Target’ sheets with your latest sales numbers (Date, Region, Product, Sales Rep, etc.). �� Step 3: Apply Filters (Slicers)Use slicers to filter your data across region, sales reps, product, and time period. �� Step 4: Review KPI Cards & ChartsCheck the overview page for quick metrics, then deep-dive into region, product, or rep-specific pages. �� Step 5: Export ReportsExport charts or pages as PDFs or images to share with leadership and teams. This dashboard is user-friendly and doesn’t require advanced Excel skills to get started. �� Who Can Benefit from This Sales Target Dashboard �� Sales Managers – Track team performance and motivate with visual KPIs. �� Business Owners – Instantly see whether goals are being met and where to intervene. �� Marketing Teams – Evaluate product performance and plan campaigns accordingly. �� Regional Heads – Drill down into localized performance to plan better. �� Corporate Executives – Use clean reports and visuals in board meetings. �� Analysts – Customize KPIs or add metrics like ASP, Profit Margin, etc. �� Retail & FMCG Brands – Monitor SKUs and fast-moving products vs target. �� Click here to read the Detailed blog post �� Visit our YouTube channel to learn step-by-step video tutorials YouTube.com/@PKAnExcelExpert Watch the step-by-step video tutorial:


 Import UK
 Import Germany
 Import UK
 Import UK