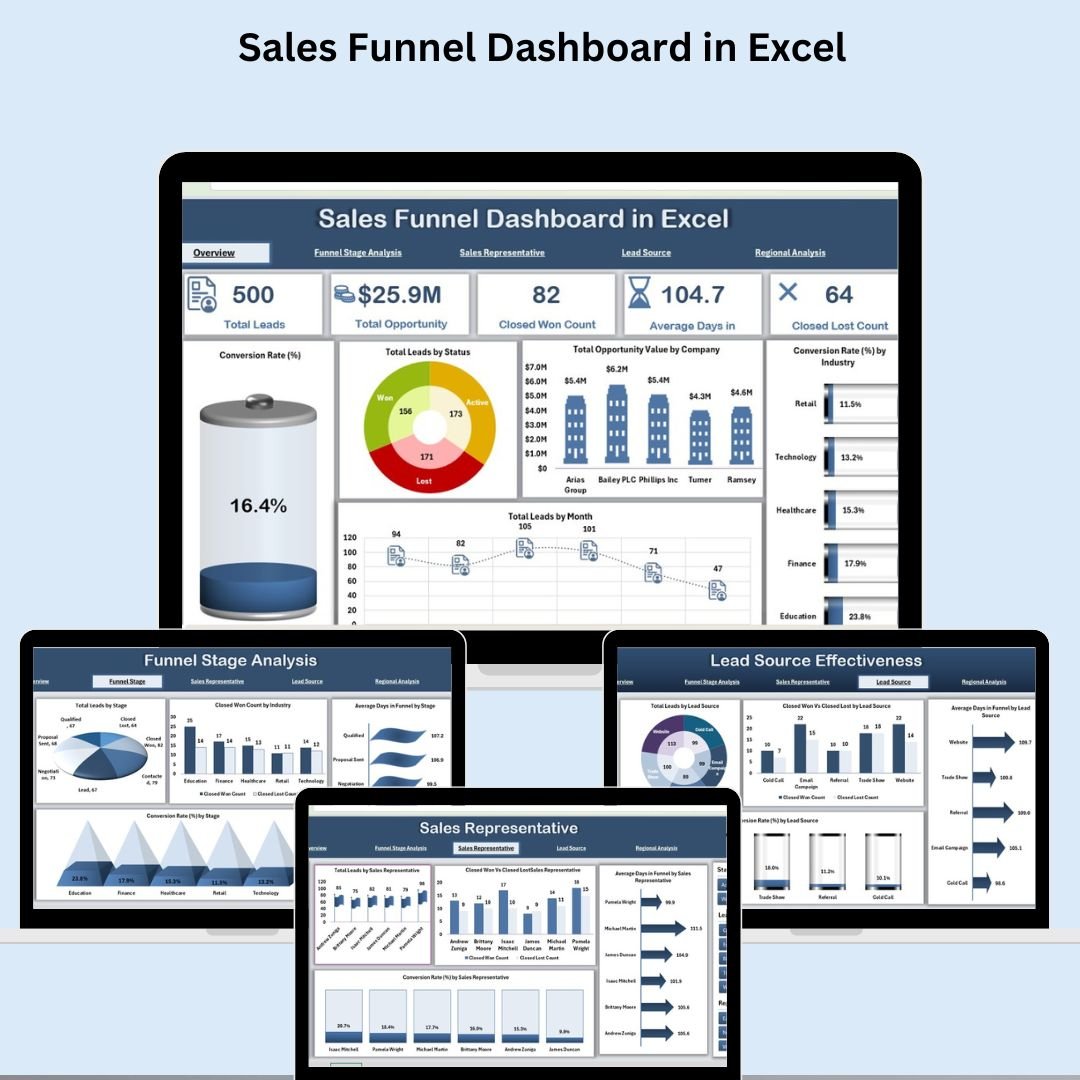
Take control of your sales process like never before with the Sales Funnel Dashboard in Excel ��—your all-in-one solution to track leads, measure performance, and boost conversion rates! Whether you’re managing a sales team or fine-tuning your pipeline, this powerful, ready-to-use template gives you the edge you need to scale your business and close more deals. �� �� Key Features of Sales Funnel Dashboard in Excel This dashboard offers unmatched visibility into each stage of your funnel. You’ll get: ✅ Visual Overview PageQuickly assess performance with metrics like Total Leads, Opportunity Value, Closed Won/Lost, and Conversion Rate. ✅ Funnel Stage InsightsUnderstand lead progression from contact to closing and identify bottlenecks using stage-by-stage analysis. ✅ Sales Rep Performance TrackingCompare closed deals, average days in funnel, and conversion rates across your sales team. ✅ Lead Source EffectivenessMeasure the ROI of each channel—social media, website, referrals, etc.—and optimize your marketing spend. ✅ Regional Sales AnalysisFind out which territories are converting and tailor your regional strategies accordingly. ✅ Fully Customizable LayoutEasily add KPIs, modify charts, and adapt the dashboard to fit your unique business needs. �� What’s Inside the Sales Funnel Dashboard You get six dynamic worksheet tabs, each designed for detailed insight: Overview Sheet – Summarizes key KPIs, including leads, conversion rates, and opportunity value with impactful charts and cards. Funnel Stage Analysis Sheet – Deep-dive into every funnel stage with performance metrics and time-in-stage calculations. Sales Representative Sheet – Evaluate sales reps individually using comparisons like Closed Won vs Lost and average funnel duration. Lead Source Effectiveness Sheet – Analyze how different lead sources are performing in terms of volume, success, and speed. Regional Analysis Sheet – Drill down on sales performance by geography to better allocate resources. Data Sheet – Enter all lead and opportunity info that powers the dashboard. Simple and structured for easy use. �� How to Use the Sales Funnel Dashboard Getting started is effortless: �� Enter Data: Fill out the Data Sheet with lead info, opportunity status, region, sales rep, and source. �� Customize Metrics: Adjust chart filters or formulas based on your specific KPIs or sales cycles. �� Review Charts: Use the built-in visuals to identify low-performing areas or sales drop-offs. �� Make Decisions: Use insights to coach reps, optimize sources, and refine regional strategy. �� Update Regularly: Refresh the dashboard with new data weekly or monthly for accurate real-time insights. �� Who Can Benefit from This Dashboard This tool is ideal for: ✅ Sales Managers – Evaluate rep performance and drive accountability.✅ Business Owners – Get a clear picture of how your funnel is working.✅ Marketing Teams – Understand which channels produce the best leads.✅ Sales Consultants – Deliver valuable insights to clients with a plug-and-play dashboard.✅ Startups & SMEs – Scale sales operations with professional tools at minimal cost.✅ Enterprise Sales Teams – Customize and expand the template to fit advanced strategies. �� Click here to read the Detailed Blog Post Watch the step-by-step video Demo: �� Visit our YouTube channel to learn step-by-step video tutorials


 Import UK
 Import Germany
 Import UK
 Import UK