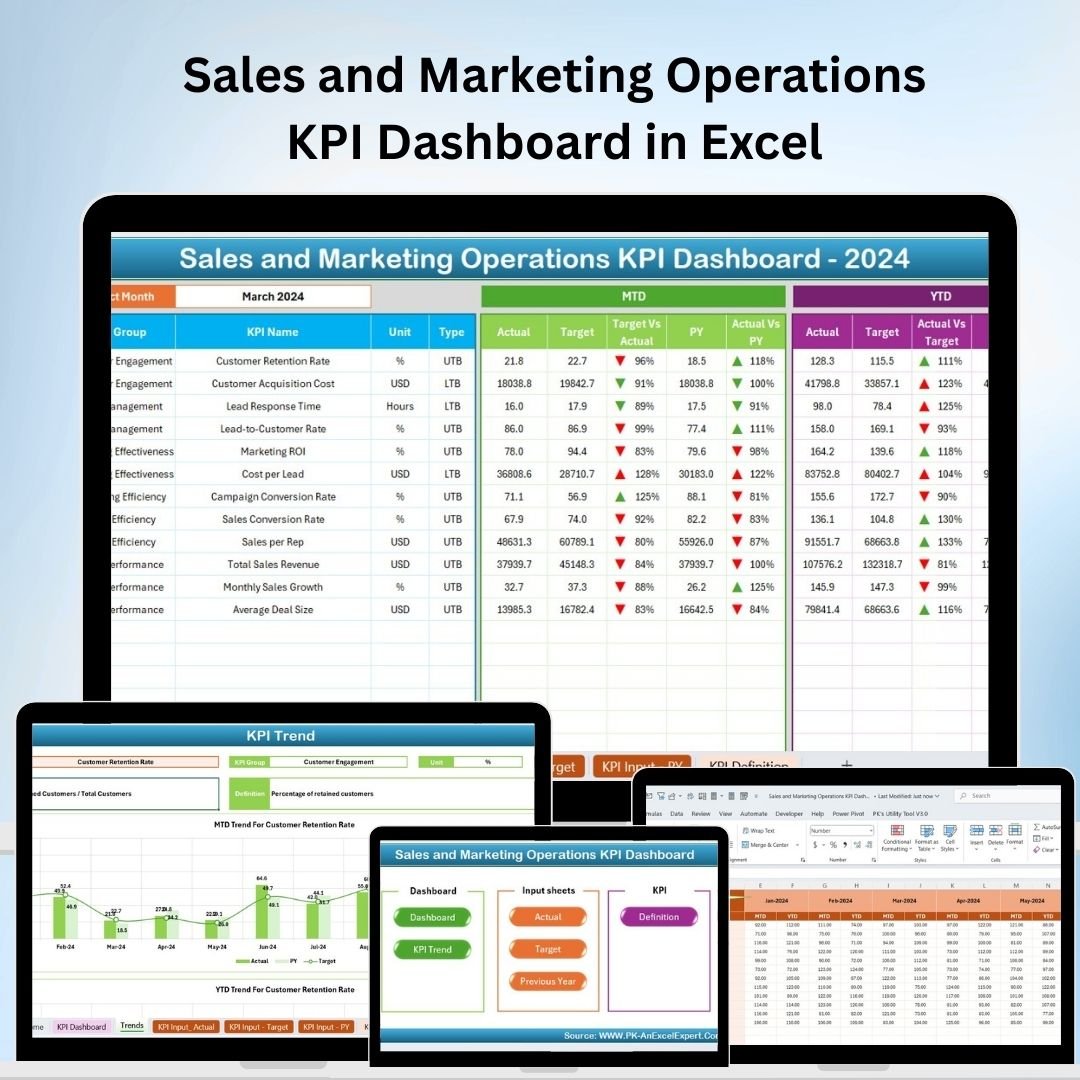
The Sales and Marketing Operations KPI Dashboard in Excel is an essential tool for businesses, sales teams, and marketing professionals looking to track and optimize their sales and marketing performance. This Excel-based dashboard offers an in-depth view of key performance indicators (KPIs) like lead generation, sales performance, customer acquisition costs, conversion rates, and campaign effectiveness, helping you make informed, data-driven decisions to drive growth and profitability. Whether you’re focusing on improving sales conversion, optimizing marketing campaigns, or tracking revenue growth, this dashboard provides real-time insights into your business’s performance. With its user-friendly interface and customizable features, you can adjust the dashboard to meet your specific business needs and track the metrics that matter most. Key Features of the Sales and Marketing Operations KPI Dashboard in Excel �� Sales Performance TrackingTrack sales performance across different metrics, including total sales, sales by region, and sales by product. Analyze trends to identify opportunities for growth and improvement. �� Lead Generation & Conversion RatesMonitor lead generation efforts and track conversion rates to assess how effectively your sales and marketing teams are turning prospects into customers. �� Customer Acquisition Costs (CAC)Track and analyze the cost of acquiring new customers. This metric is crucial for understanding the return on investment (ROI) of your marketing efforts and refining your customer acquisition strategies. �� Campaign Effectiveness AnalysisMeasure the success of your marketing campaigns in terms of engagement, conversions, and overall impact on sales. Use this data to optimize future marketing strategies and improve campaign performance. �� Time-Based Performance TrackingMonitor sales and marketing performance over different time periods (daily, weekly, monthly). Use time-based data to analyze trends, seasonality, and the impact of specific campaigns. ⚙️ Customizable KPIs & MetricsTailor the dashboard to track the specific KPIs most relevant to your business. Add, remove, or adjust metrics to align with your sales and marketing goals. Why You’ll Love the Sales and Marketing Operations KPI Dashboard in Excel Sales and Marketing Operations KPI Dashboard ✅ Comprehensive Sales & Marketing InsightsTrack key performance metrics across both sales and marketing operations. Gain a holistic view of your business’s performance, from lead generation to sales conversion. ✅ Optimize Marketing CampaignsMonitor the effectiveness of marketing campaigns, assess engagement, and identify areas for improvement. Adjust strategies based on real-time data to drive better results. ✅ Improve Sales Team EfficiencyAnalyze sales performance across various regions, products, and teams. Identify top-performing areas and areas that need more attention to boost overall sales performance. ✅ Data-Driven DecisionsUse the insights from this dashboard to make informed, data-driven decisions for improving marketing strategies, optimizing sales processes, and increasing ROI. ✅ Customizable & ScalableThe dashboard is fully customizable to meet your specific sales and marketing needs. Whether you’re a small business or a large enterprise, this tool is scalable to fit your requirements. What’s Inside the Sales and Marketing Operations KPI Dashboard in Excel? Sales Performance Tracking: Monitor key sales metrics like total sales, regional sales, and product-specific performance. Lead Generation & Conversion Tracking: Track lead generation efforts and conversion rates to measure marketing success. Customer Acquisition Cost (CAC) Analysis: Monitor the cost of acquiring customers and optimize marketing spend. Campaign Effectiveness Monitoring: Analyze the effectiveness of marketing campaigns across different channels. Time-Based Performance Tracking: Track sales and marketing performance over different time periods. Customizable KPIs & Metrics: Tailor the dashboard to suit your unique sales and marketing goals. How to Use the Sales and Marketing Operations KPI Dashboard in Excel 1️⃣ Download the Template: Instantly access the Sales and Marketing Operations KPI Dashboard in Excel.2️⃣ Input Your Sales & Marketing Data: Add data for sales, leads, customer acquisition costs, and campaign performance.3️⃣ Monitor KPIs & Performance: Track important metrics such as sales figures, lead generation, conversion rates, and marketing ROI.4️⃣ Analyze Trends & Insights: Use time-based analysis to monitor sales and marketing performance over various periods.5️⃣ Optimize Your Sales & Marketing Strategy: Use the data insights to adjust and refine your sales and marketing strategies. Who Can Benefit from the Sales and Marketing Operations KPI Dashboard in Excel? �� Sales Teams & Managers�� Marketing Teams & Managers�� Business Owners & Executives�� E-commerce Platforms & Online Retailers�� Data Analysts & Performance Managers�� Consultants & Marketing Agencies�� Small & Medium Enterprises (SMBs) Ensure your sales and marketing strategies are optimized with the Sales and Marketing Operations KPI Dashboard in Excel. Track performance, monitor KPIs, and drive growth through data-driven decisions. Click here to read the Detailed blog post Visit our YouTube channel to learn step-by-step video tutorialsYoutube.com/@PKAnExcelExpert Watch the step-by-step video Demo:


 Import UK
 Import Germany
 Import UK
 Import UK