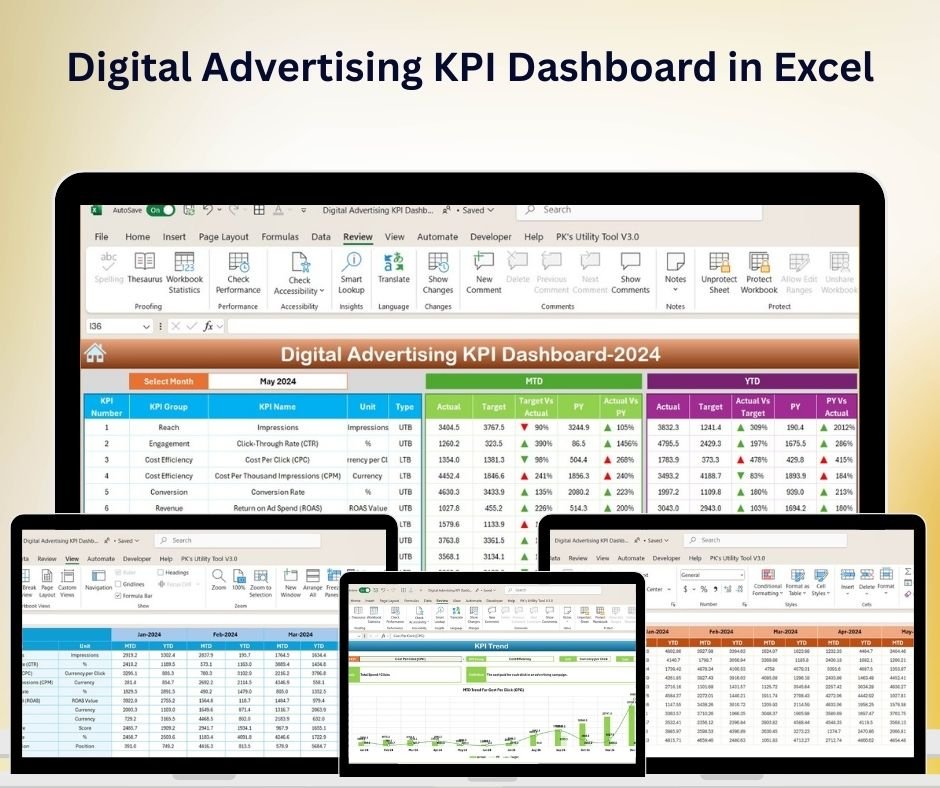
The Digital Advertising KPI Dashboard in Excel is a comprehensive tool designed to help marketers, advertisers, and business owners track and optimize the performance of their digital advertising campaigns. This Excel-based dashboard provides valuable insights into key performance indicators (KPIs) such as click-through rate (CTR), conversion rates, cost per click (CPC), and return on investment (ROI), allowing you to make data-driven decisions that maximize the effectiveness of your campaigns. With a clear and intuitive layout, this dashboard makes it easy to track campaign performance across multiple platforms, such as Google Ads, Facebook, and Instagram. Whether you’re running a small-scale ad campaign or managing large digital advertising projects, this dashboard gives you real-time insights into how your ads are performing and where you can improve. digital advertising Key Features of the Digital Advertising KPI Dashboard in Excel �� Campaign Performance TrackingMonitor essential KPIs like CTR, CPC, cost per acquisition (CPA), and conversion rates to assess the success of your campaigns in real-time. Track both paid and organic ad performance across multiple platforms. �� ROI & Revenue TrackingEvaluate the return on investment for your digital ads by measuring revenue generated compared to ad spend. This feature helps you ensure that your advertising budget is being effectively allocated. �� Cost Efficiency MonitoringTrack ad spending over time and assess the cost efficiency of your campaigns. Compare the cost per click or cost per impression to the revenue generated to ensure profitability. �� Time-Based Performance AnalysisMonitor campaign performance over different time periods, such as daily, weekly, or monthly. Use this feature to identify trends and optimize your ads for better performance. ⚙️ Customizable KPIsTailor the dashboard to meet the specific needs of your business. Add custom KPIs, adjust your ad platforms, and modify performance metrics to fit your unique advertising goals. �� Ad Platform ComparisonCompare the performance of different ad platforms, such as Google Ads, Facebook, Instagram, and others, all in one place. Identify which platform delivers the best ROI and optimize accordingly. Why You’ll Love the Digital Advertising KPI Dashboard in Excel ✅ Comprehensive Performance InsightsTrack and analyze all essential KPIs for your digital advertising campaigns. From CTR to revenue, monitor everything in one place. ✅ Maximize Advertising ROIMeasure the return on investment from your campaigns and adjust your strategies to ensure that you are getting the most out of your ad spend. ✅ Improve Ad CampaignsAnalyze data across multiple platforms to identify areas of improvement. Use insights to optimize your ads and boost campaign performance. ✅ Efficient Budget ManagementTrack spending and assess cost-efficiency to make sure that your advertising budget is being utilized effectively and generating the desired outcomes. ✅ Customizable & ScalableThe dashboard is customizable to meet your specific digital advertising needs. Adjust the KPIs and performance metrics as your business or ad strategy evolves. What’s Inside the Digital Advertising KPI Dashboard in Excel? Campaign Performance Tracking: Monitor KPIs such as CTR, CPC, CPA, and conversion rates. ROI & Revenue Tracking: Assess your return on investment from ad campaigns. Cost Efficiency Monitoring: Track ad spending and evaluate cost per click or cost per impression. Time-Based Analysis: Evaluate performance trends over different periods. Customizable KPIs: Tailor the dashboard to suit your ad campaign goals. Ad Platform Comparison: Compare performance across different platforms like Google Ads and Facebook. How to Use the Digital Advertising KPI Dashboard in Excel 1️⃣ Download the Template: Instantly access the Digital Advertising KPI Dashboard in Excel.2️⃣ Input Your Ad Data: Enter data such as clicks, conversions, cost, and revenue from your ad campaigns.3️⃣ Monitor KPIs & Performance: Track KPIs such as CTR, CPC, and ROI.4️⃣ Analyze Campaign Trends: Use time-based performance analysis to identify trends and optimize campaigns.5️⃣ Make Data-Driven Decisions: Leverage insights from the dashboard to adjust your ad strategies for better results. Who Can Benefit from the Digital Advertising KPI Dashboard in Excel? �� Digital Marketers & Advertisers�� Marketing Agencies�� E-commerce Stores & Online Retailers�� Business Owners & Entrepreneurs�� Social Media Managers�� Analytics Teams�� Campaign Managers & Consultants Optimize your digital advertising campaigns with the Digital Advertising KPI Dashboard in Excel. Track key performance metrics, measure ROI, and improve the overall efficiency of your advertising efforts. Click here to read the Detailed blog post Visit our YouTube channel to learn step-by-step video tutorialsYoutube.com/@PKAnExcelExpert


 Import UK
 Import Germany
 Import UK
 Import UK